


For enhanced views of the charts, download and view on the Substack App. Please subscribe and share if you find these posts helpful and want more sent to your inbox. Learn more about the Breakout Charting Service HERE.
Major Indices:
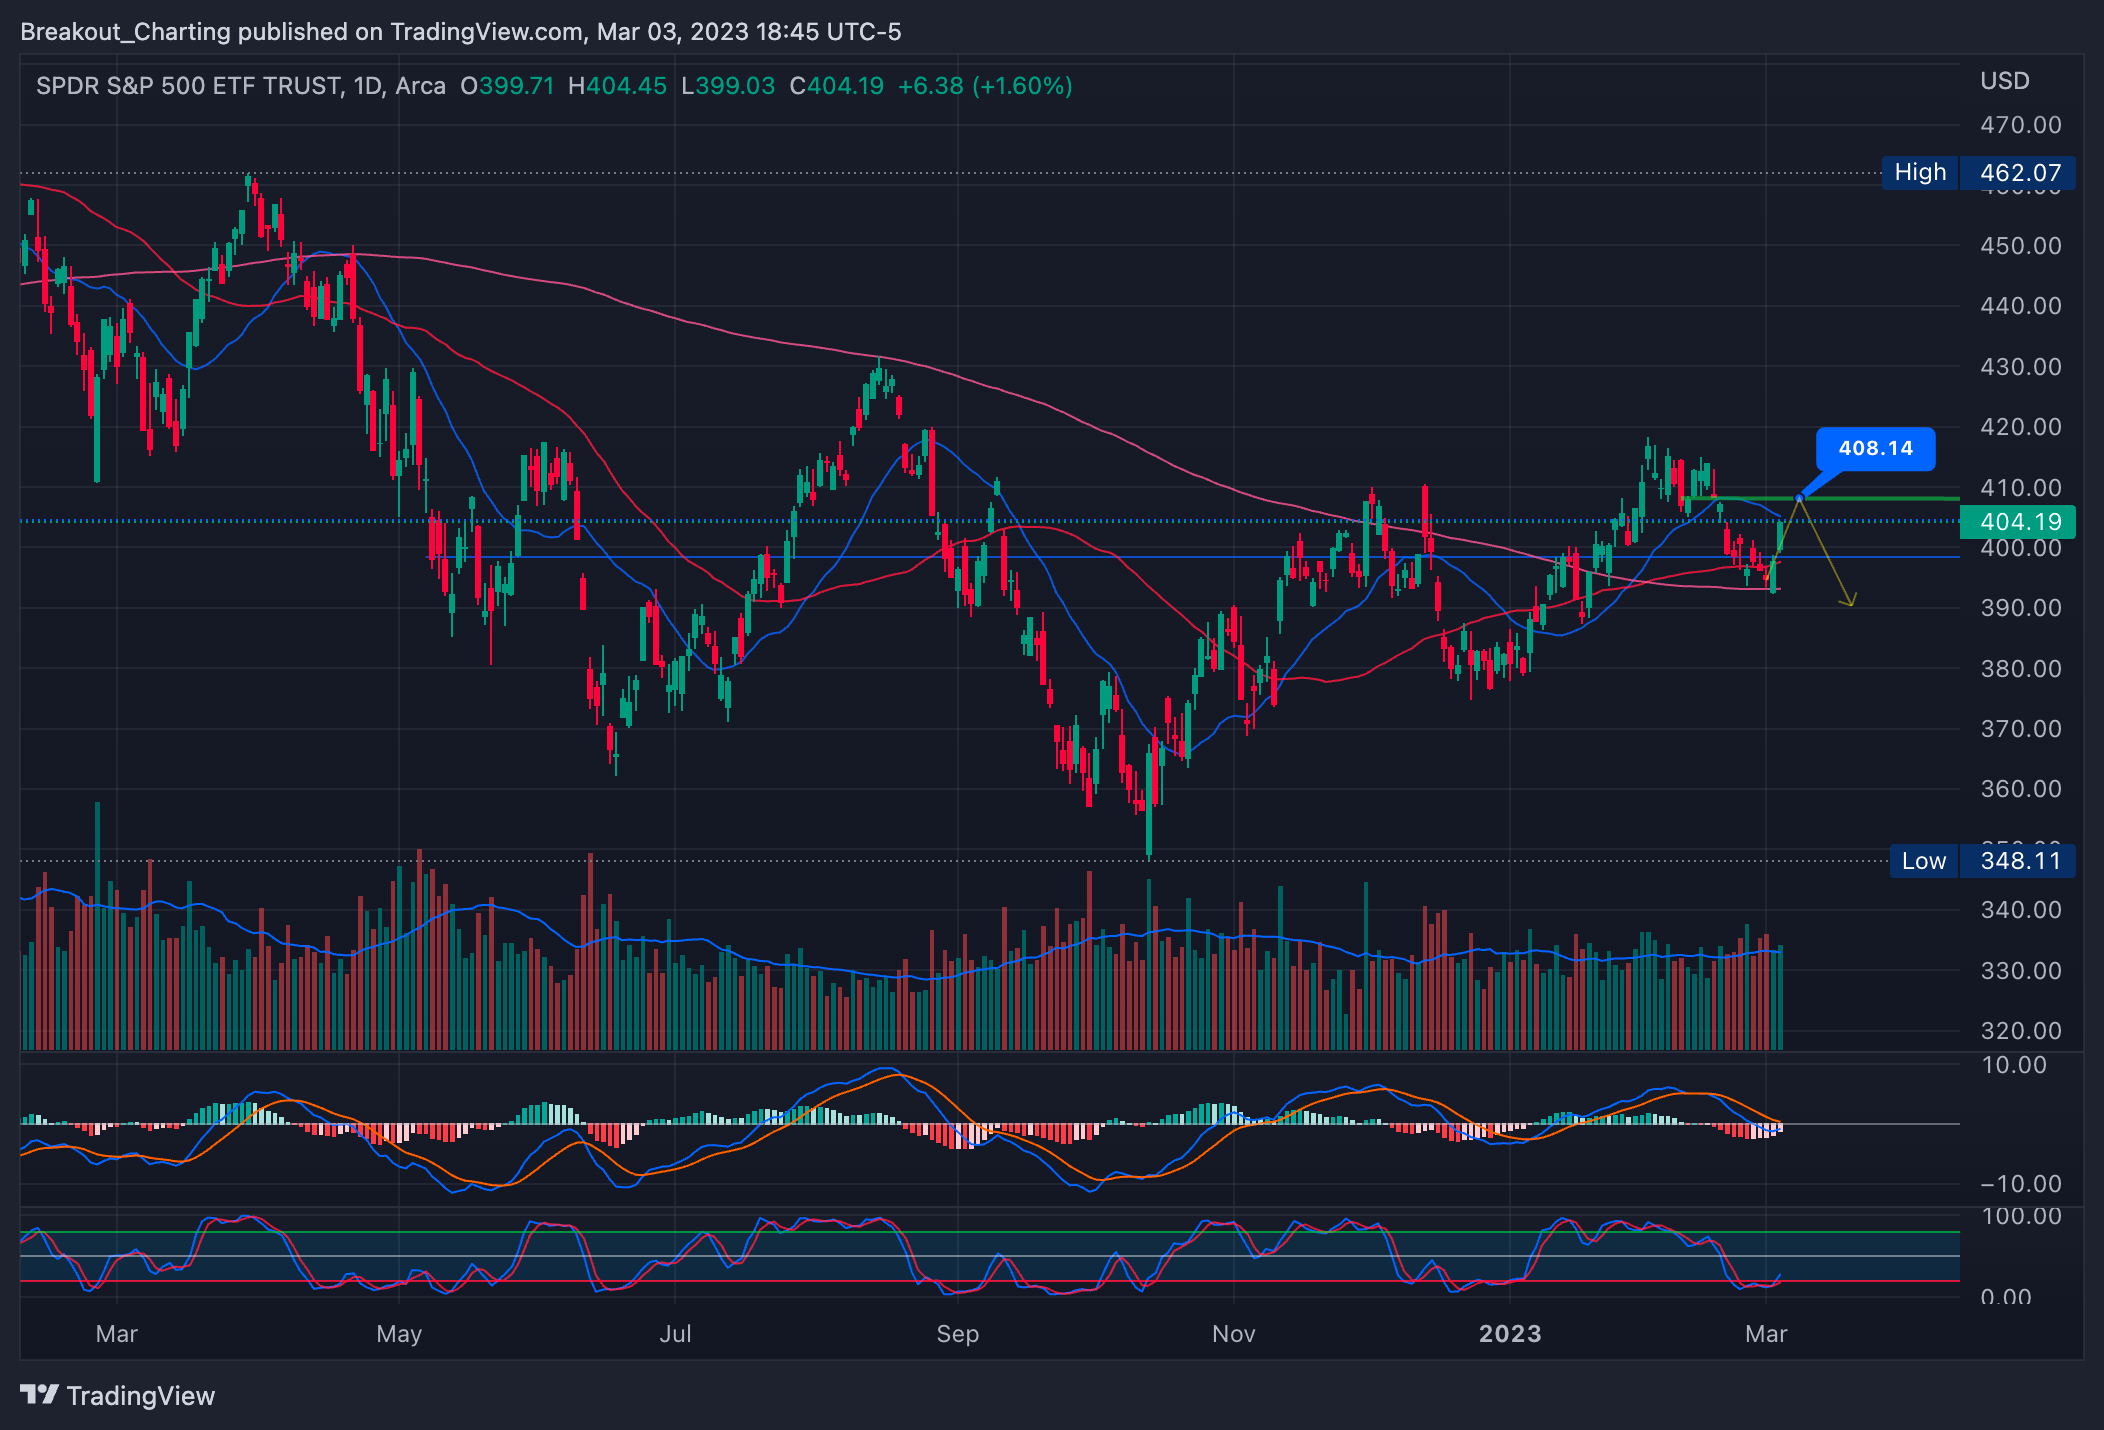
SPY - S&P500 ETF: On that Daily, we’ve snapped back to the 20ma. I think we can move higher to at least the 408.14 gap fill. before pulling back. My line in the sand would be 408.14 if you have any shorts or puts.
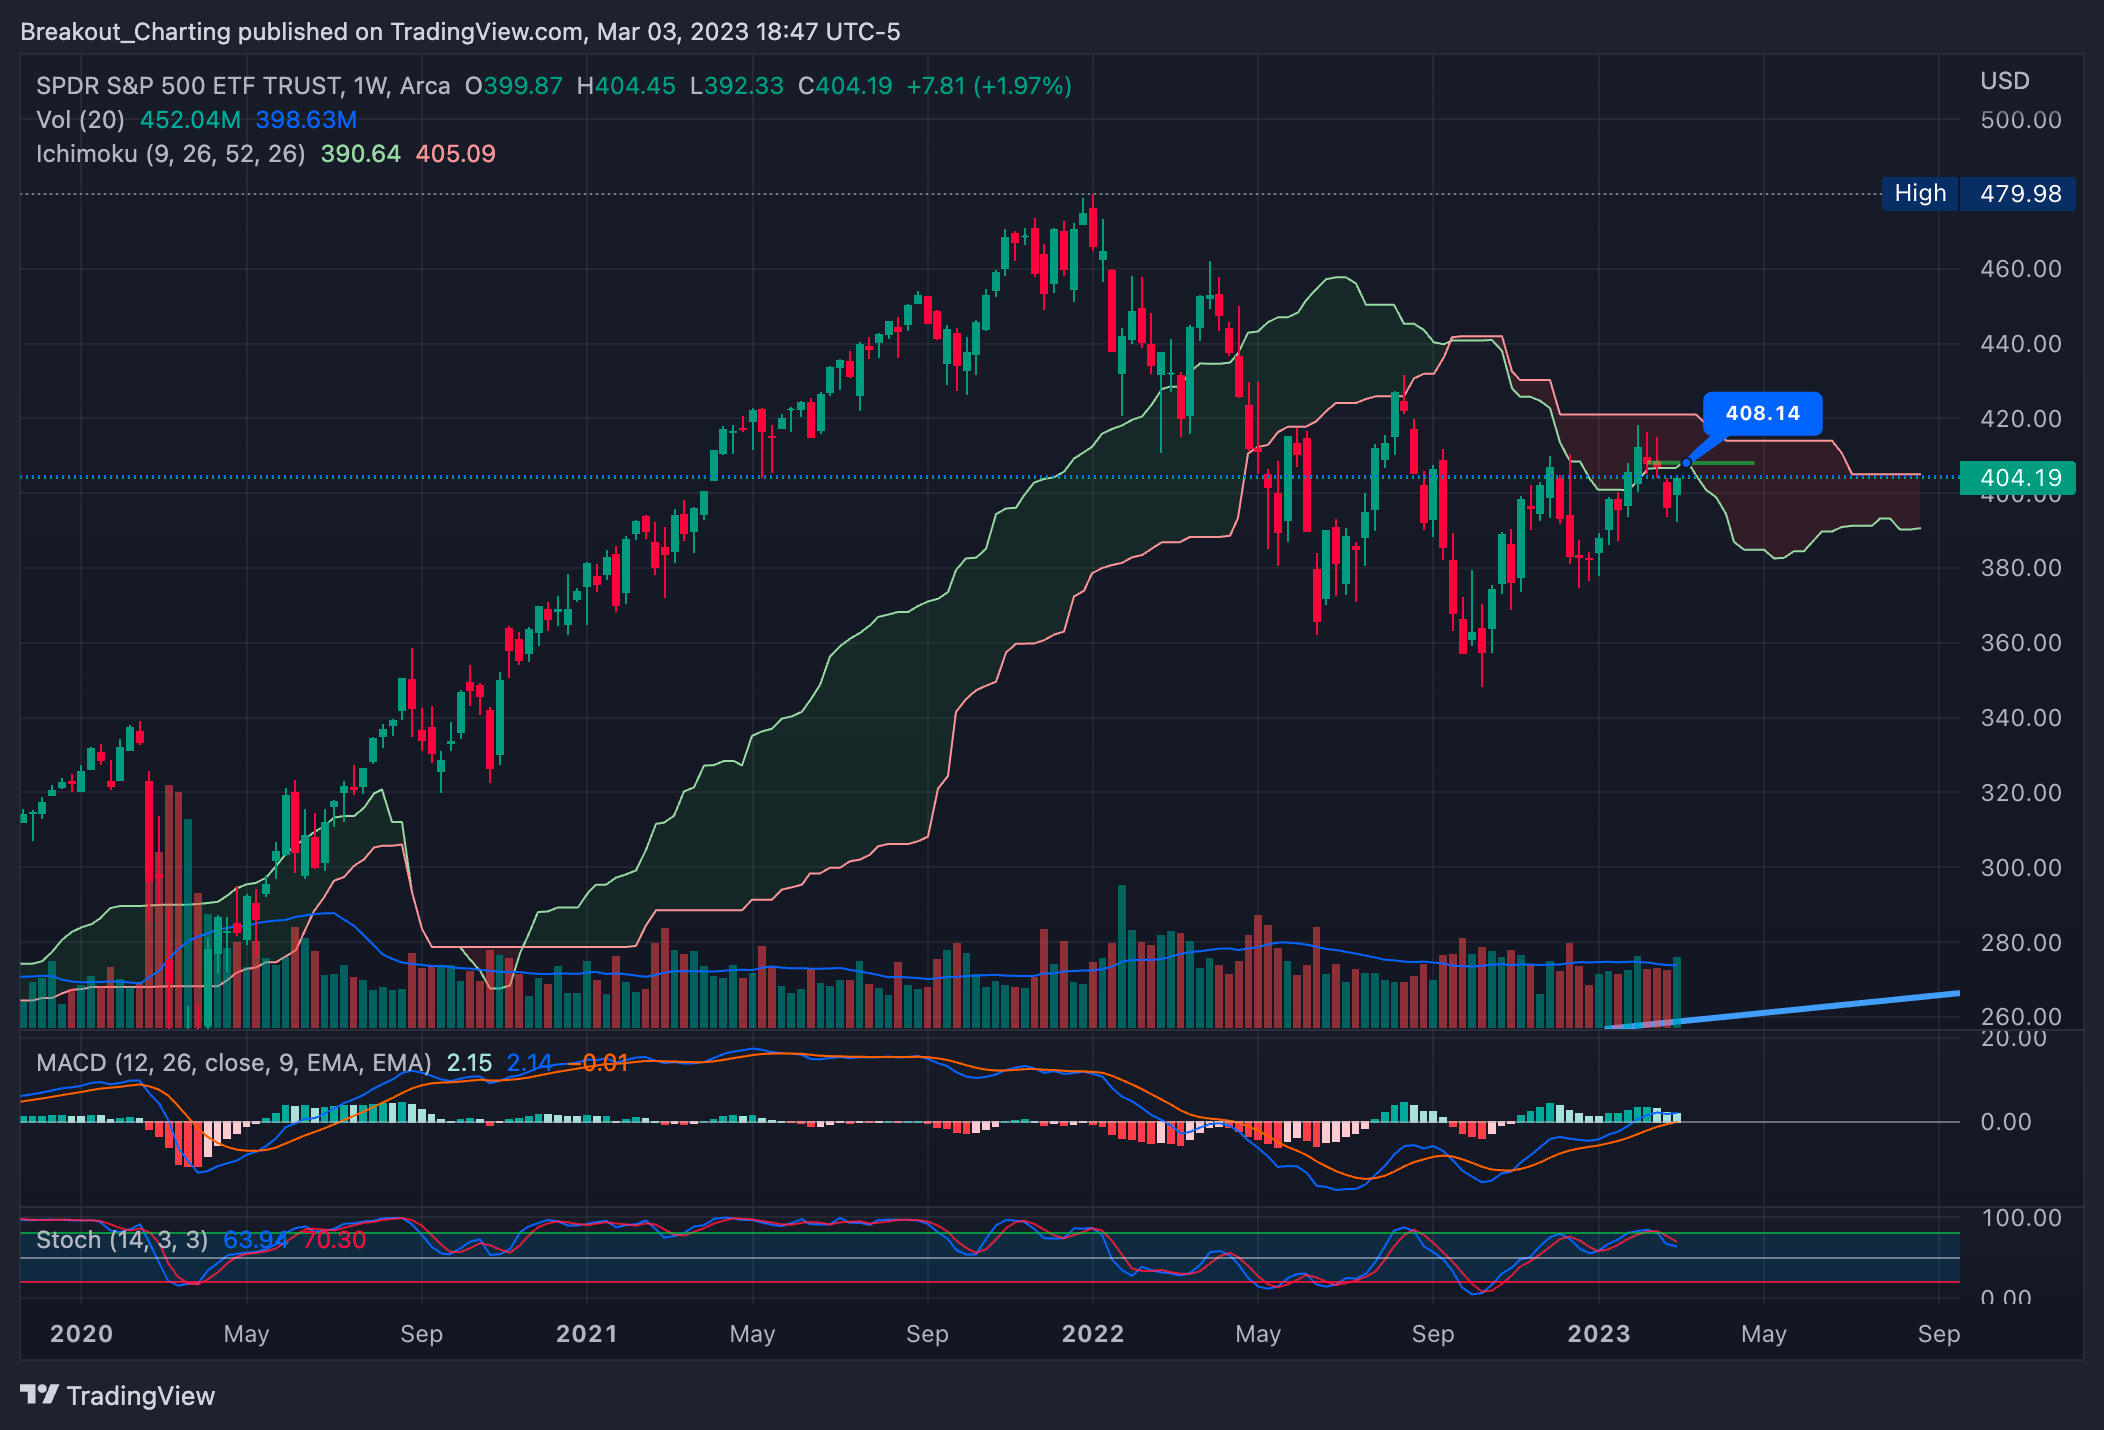
Weekly: Hammer candle with good volume. This could retest the trend cloud where that 408.14 is about.
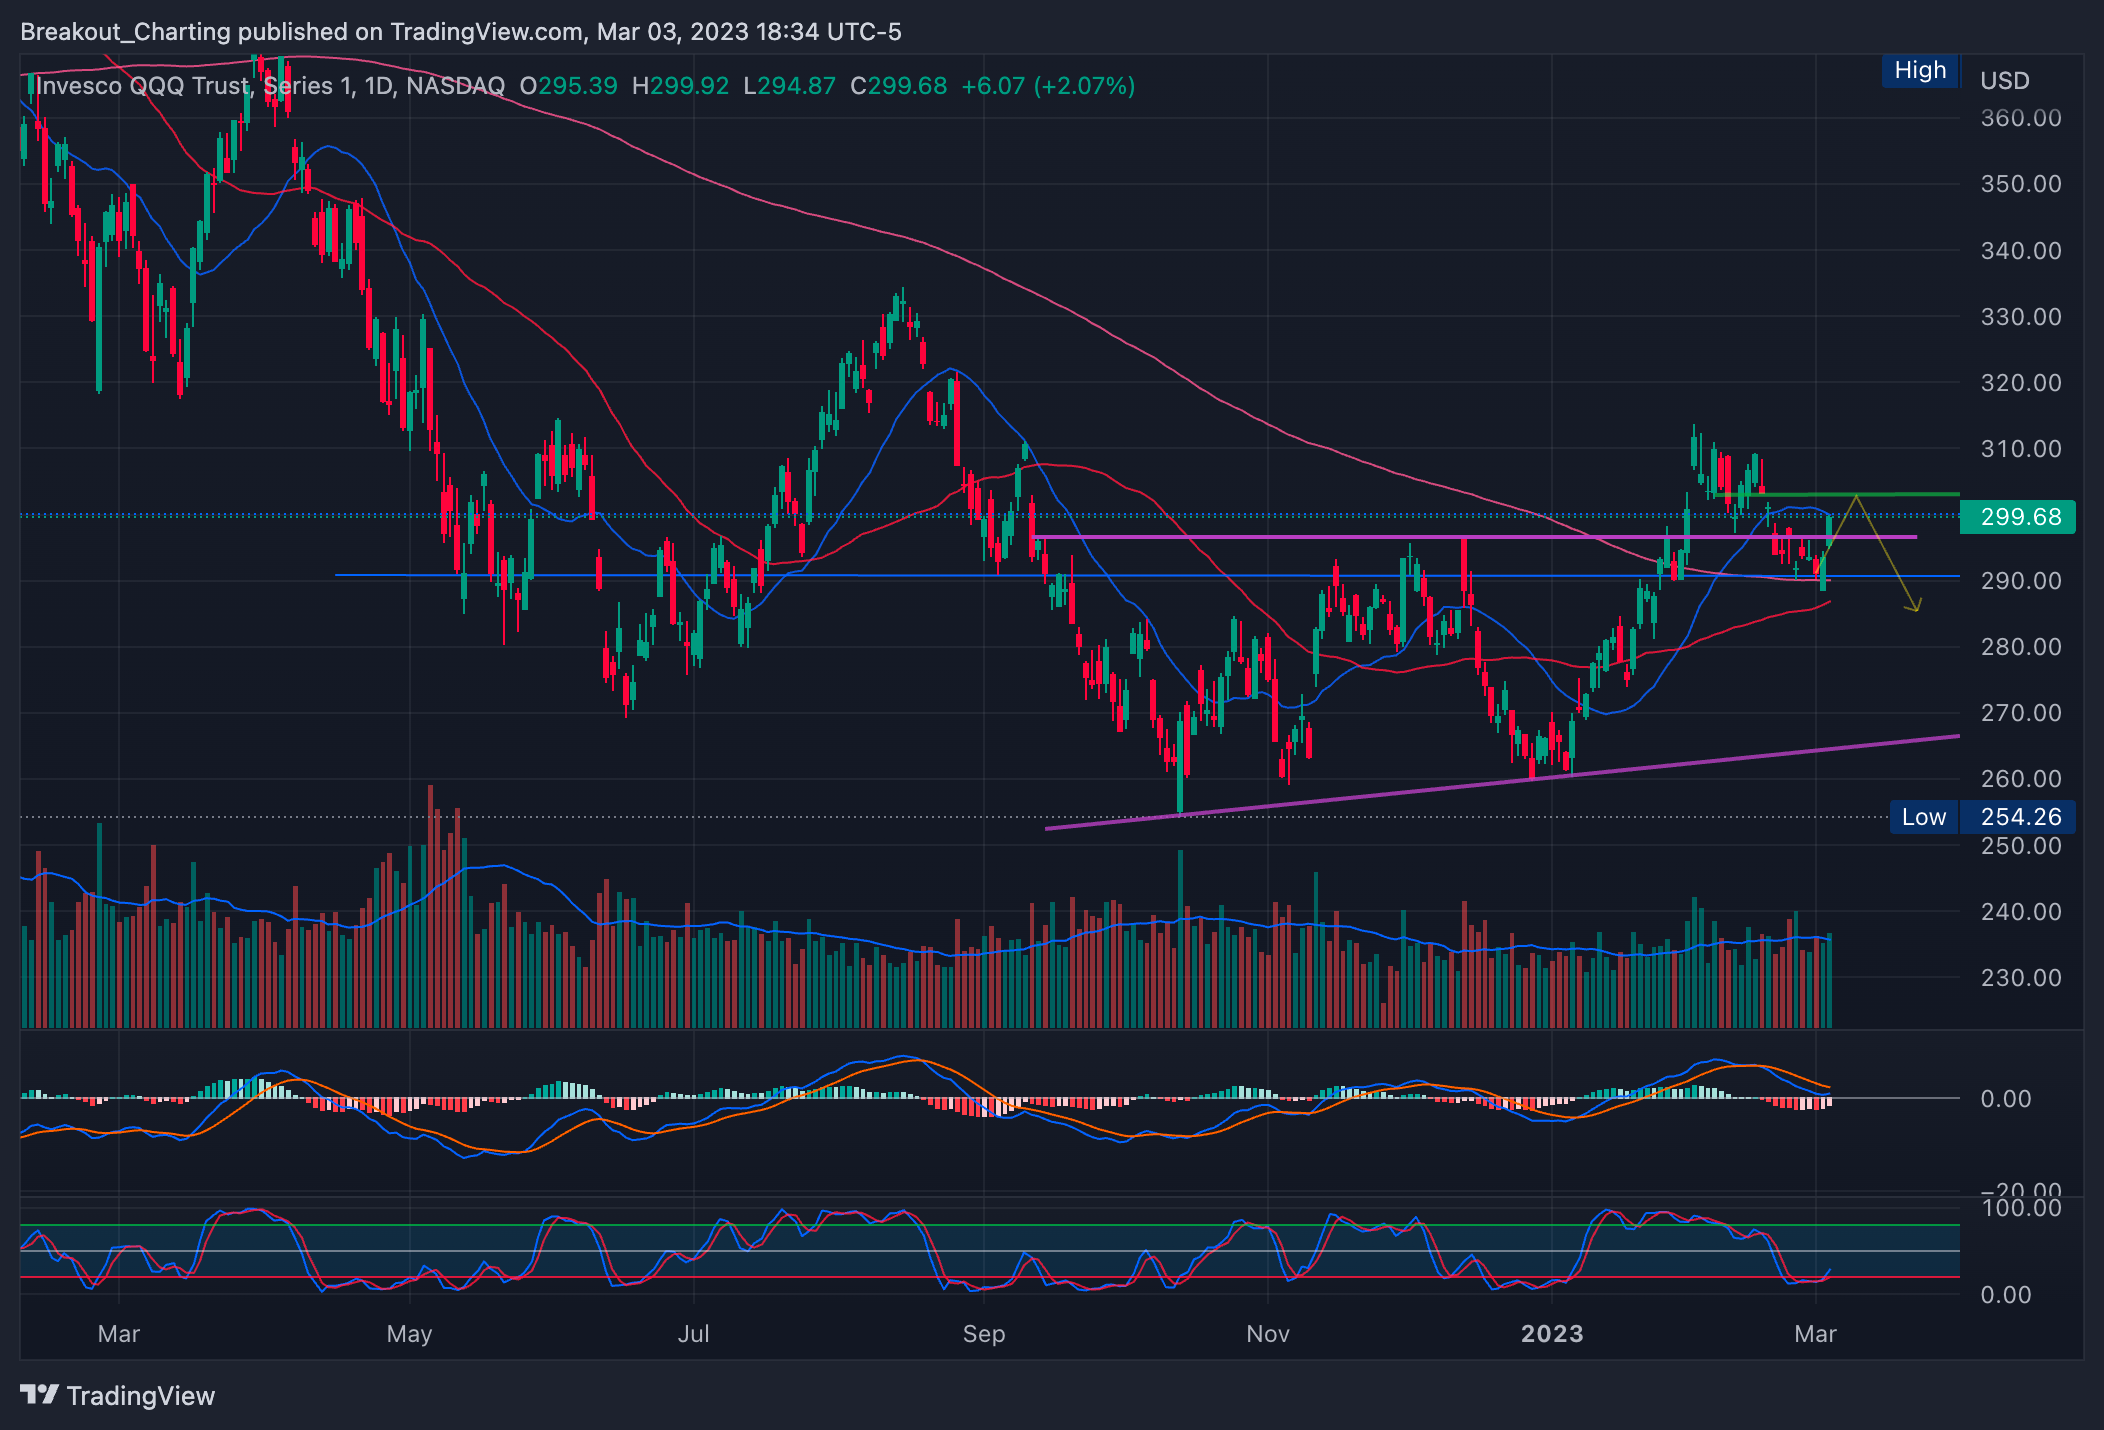
QQQ - NASDAQ100 ETF: On the daily, we retested the 20ma like predicted, I think this could go higher to 303.15 gap fill before moving lower.
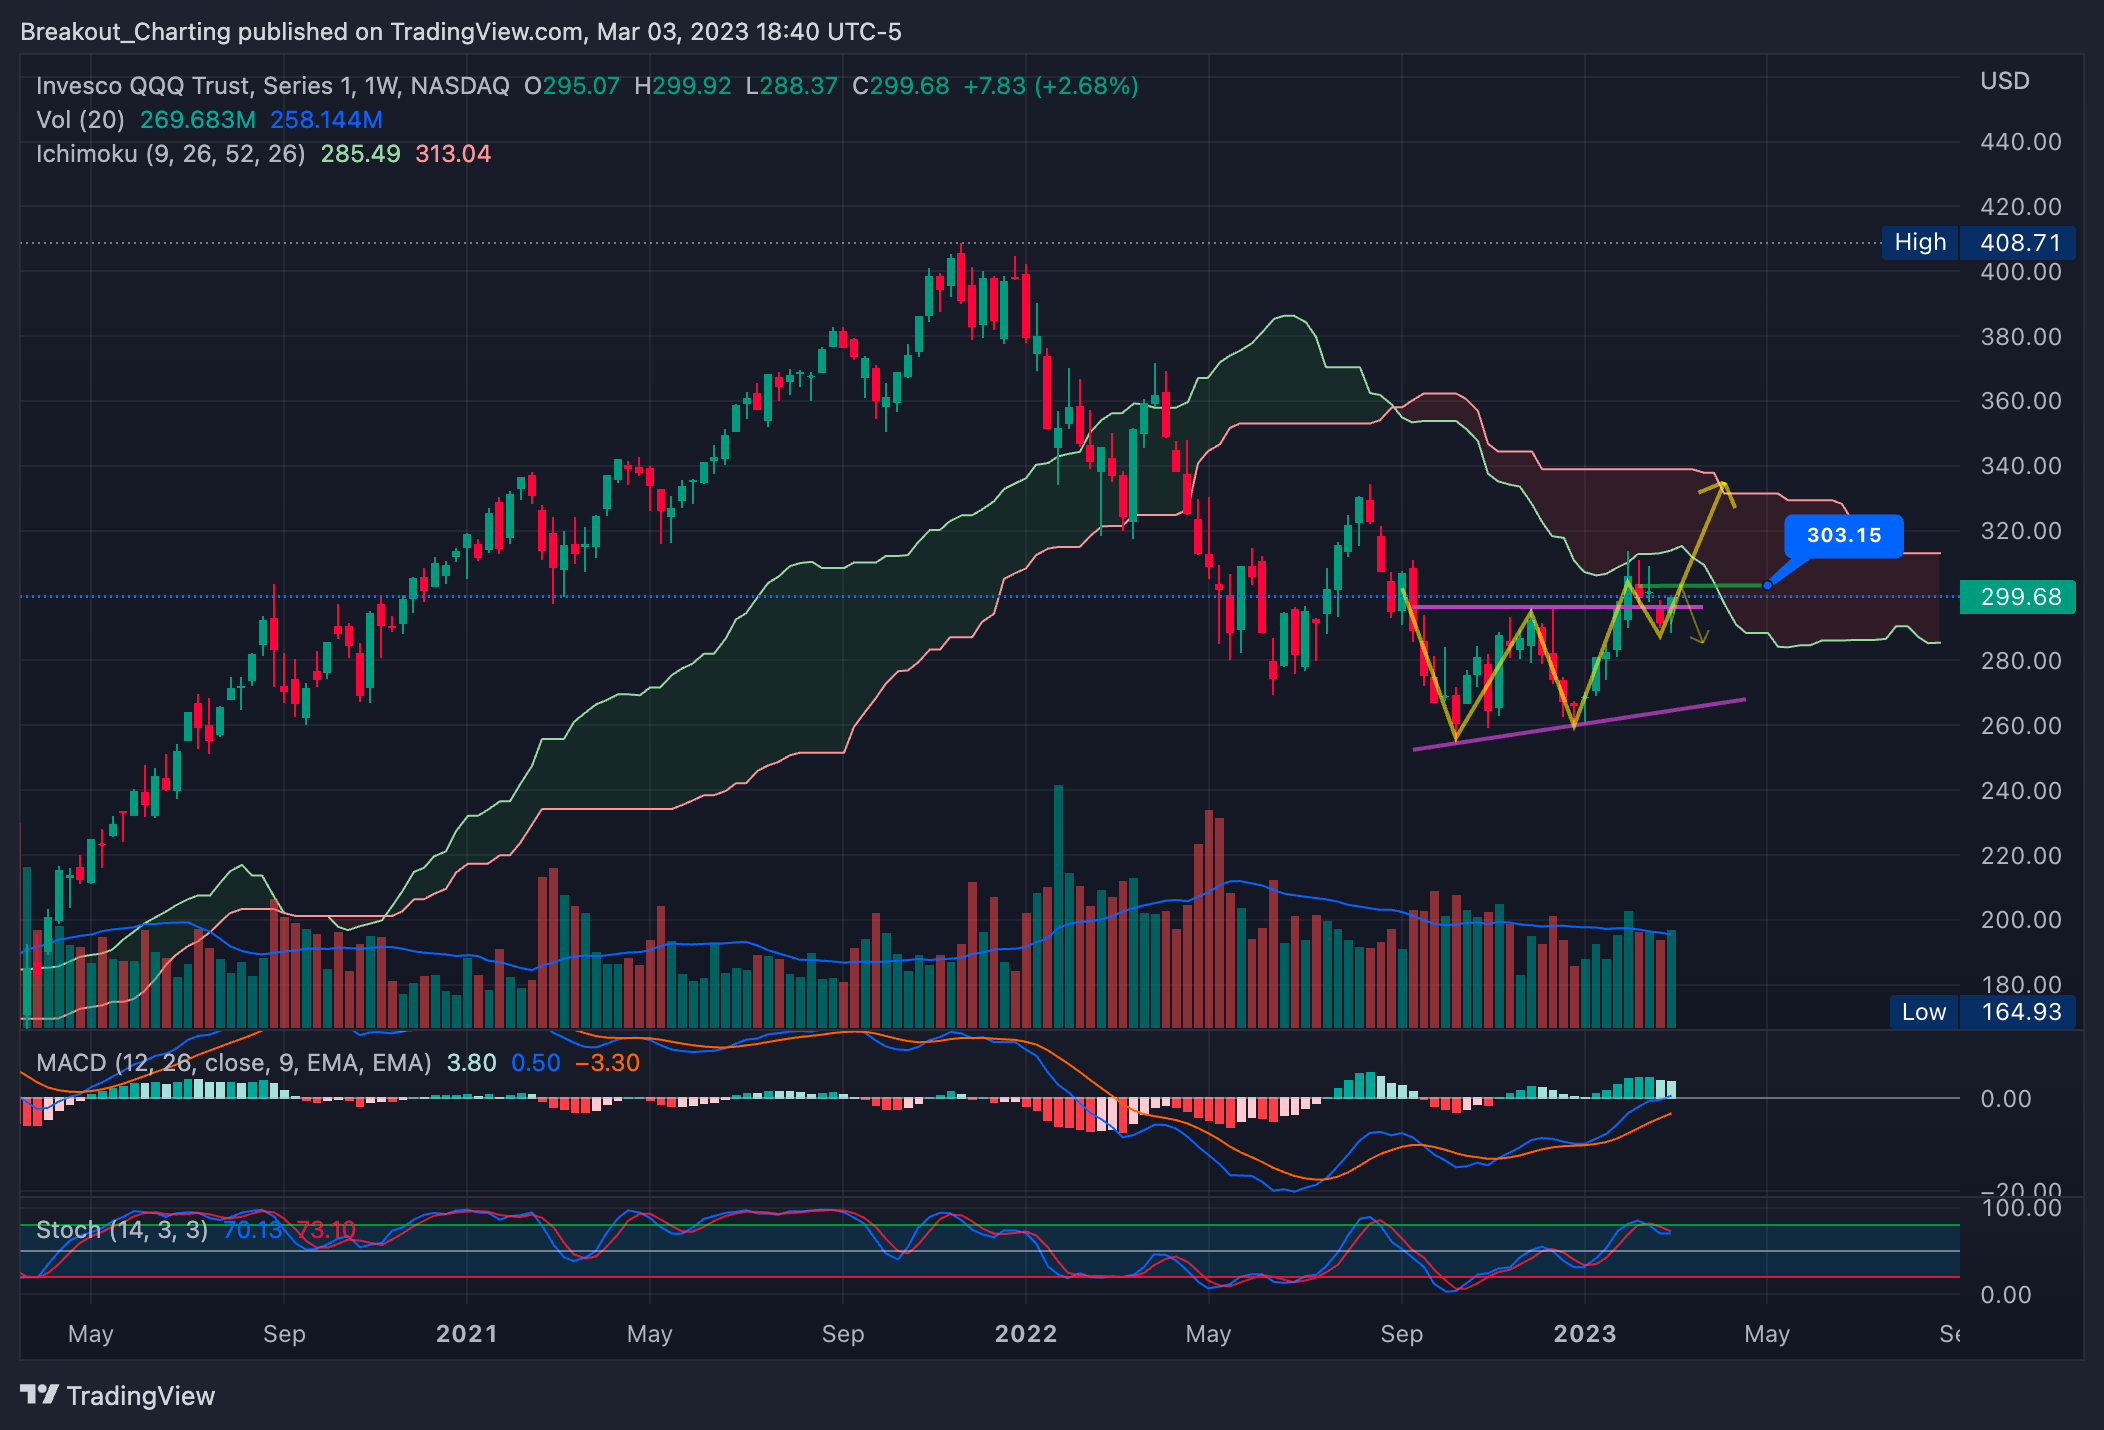
Weekly: Actually pretty bullish looking structure of a double bottom and handle. 303.15 would be my line in the sand if you have any shorts or puts unless you wanted to ride this all the way up to 310-312 where the trend cloud is.
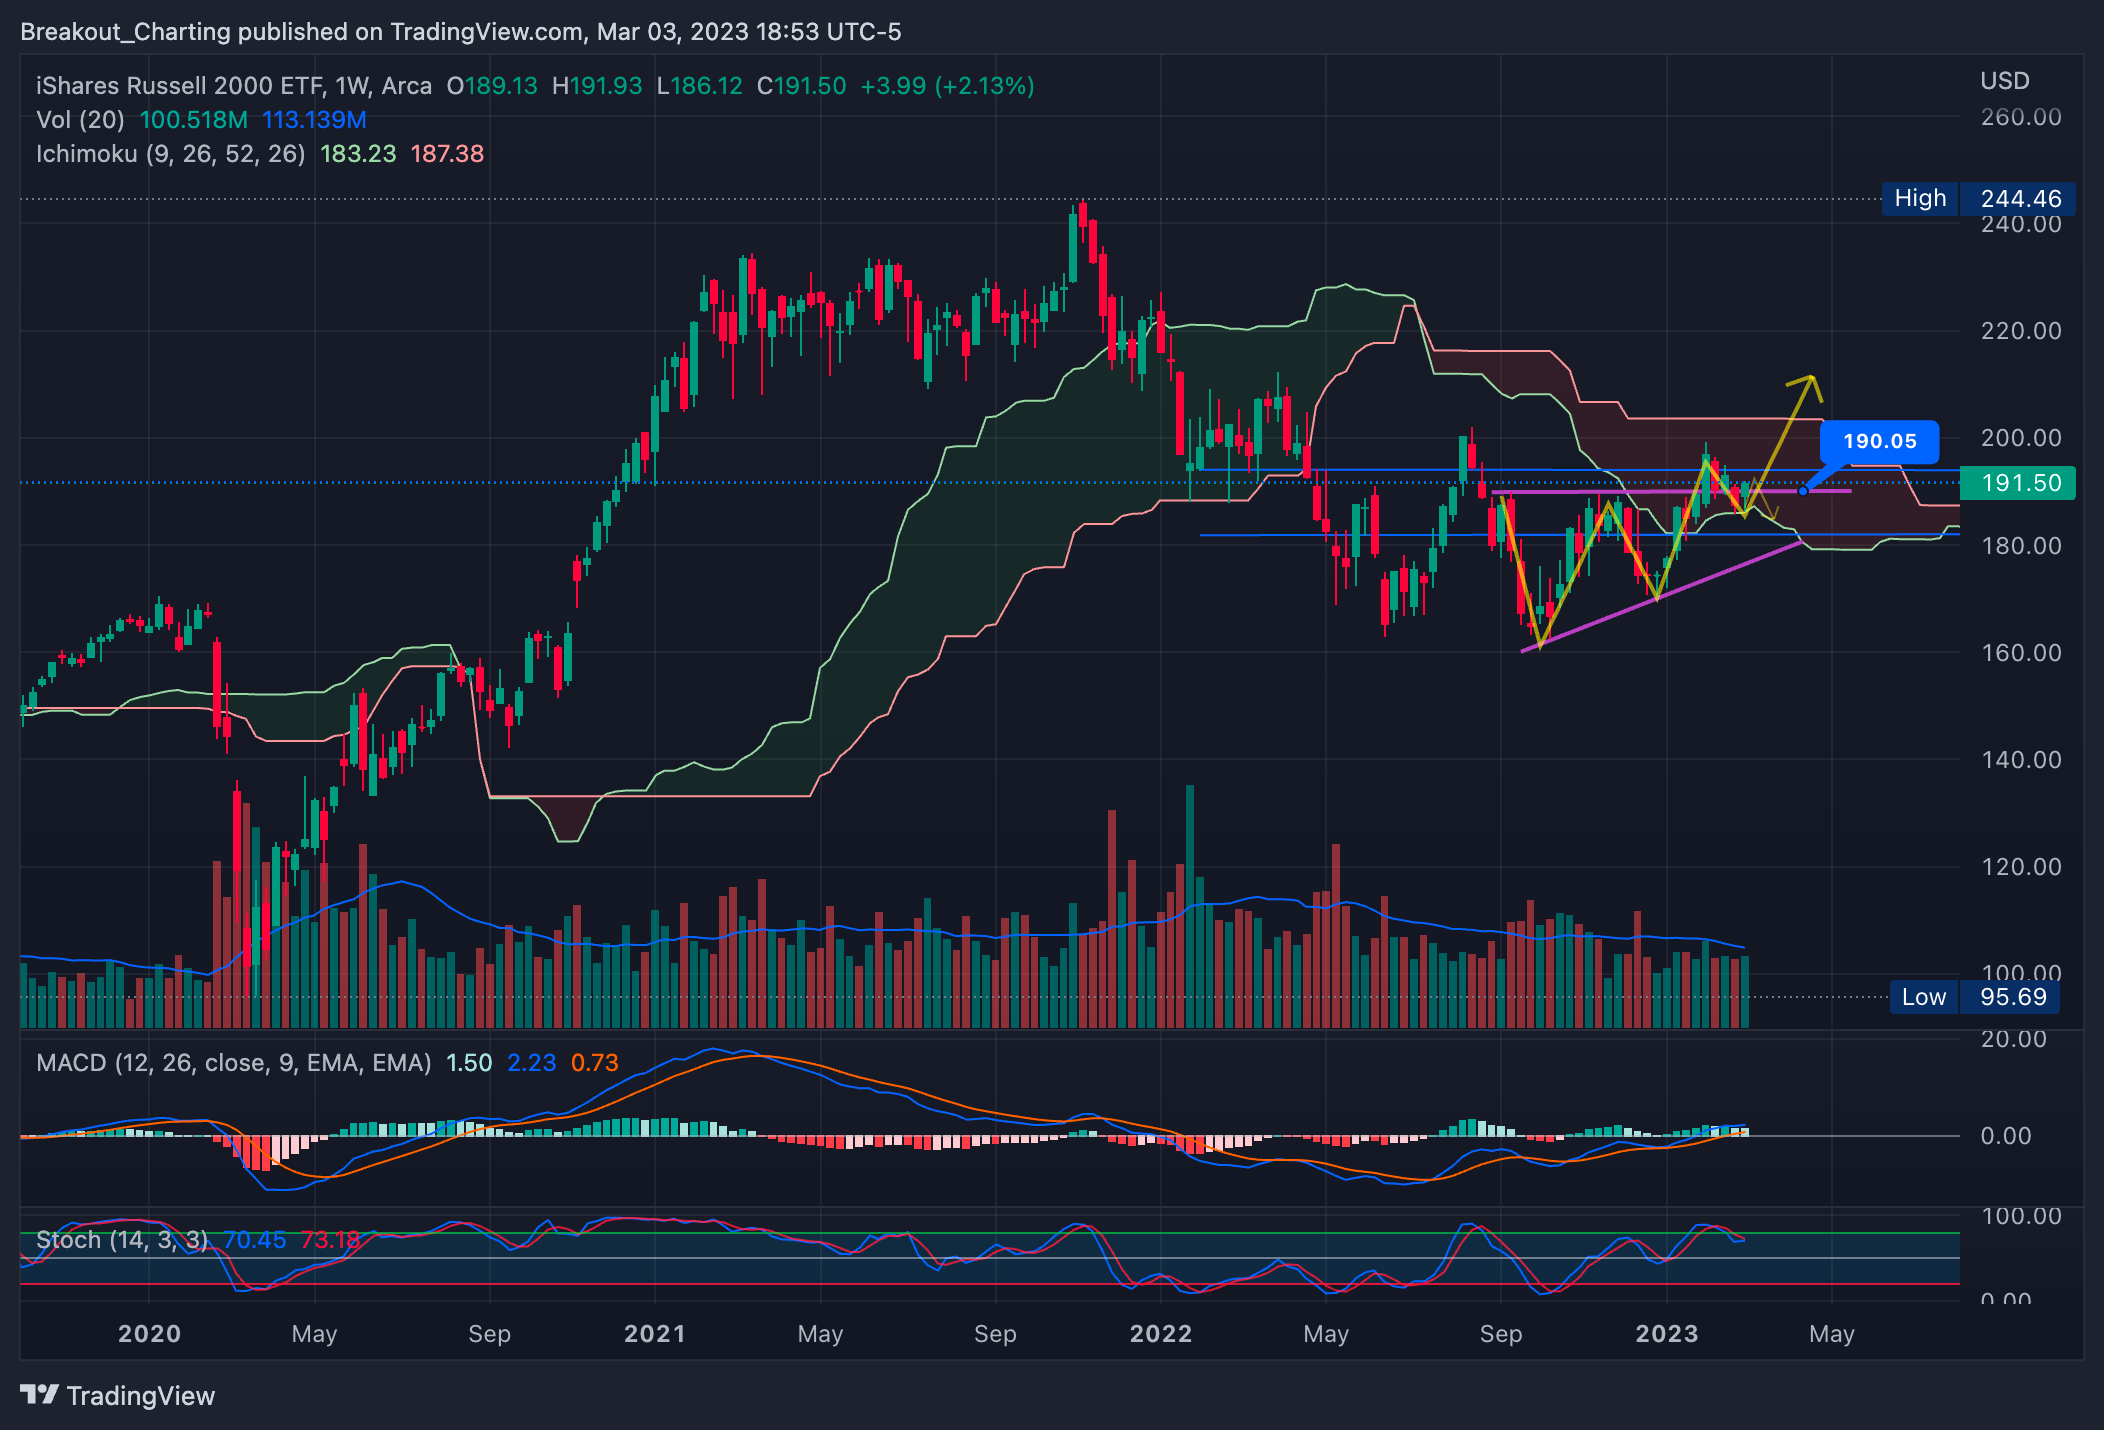
IWM - Russell 2000 ETF: On the Daily, think this could continue to bounce to 194 Fib level before pulling back.
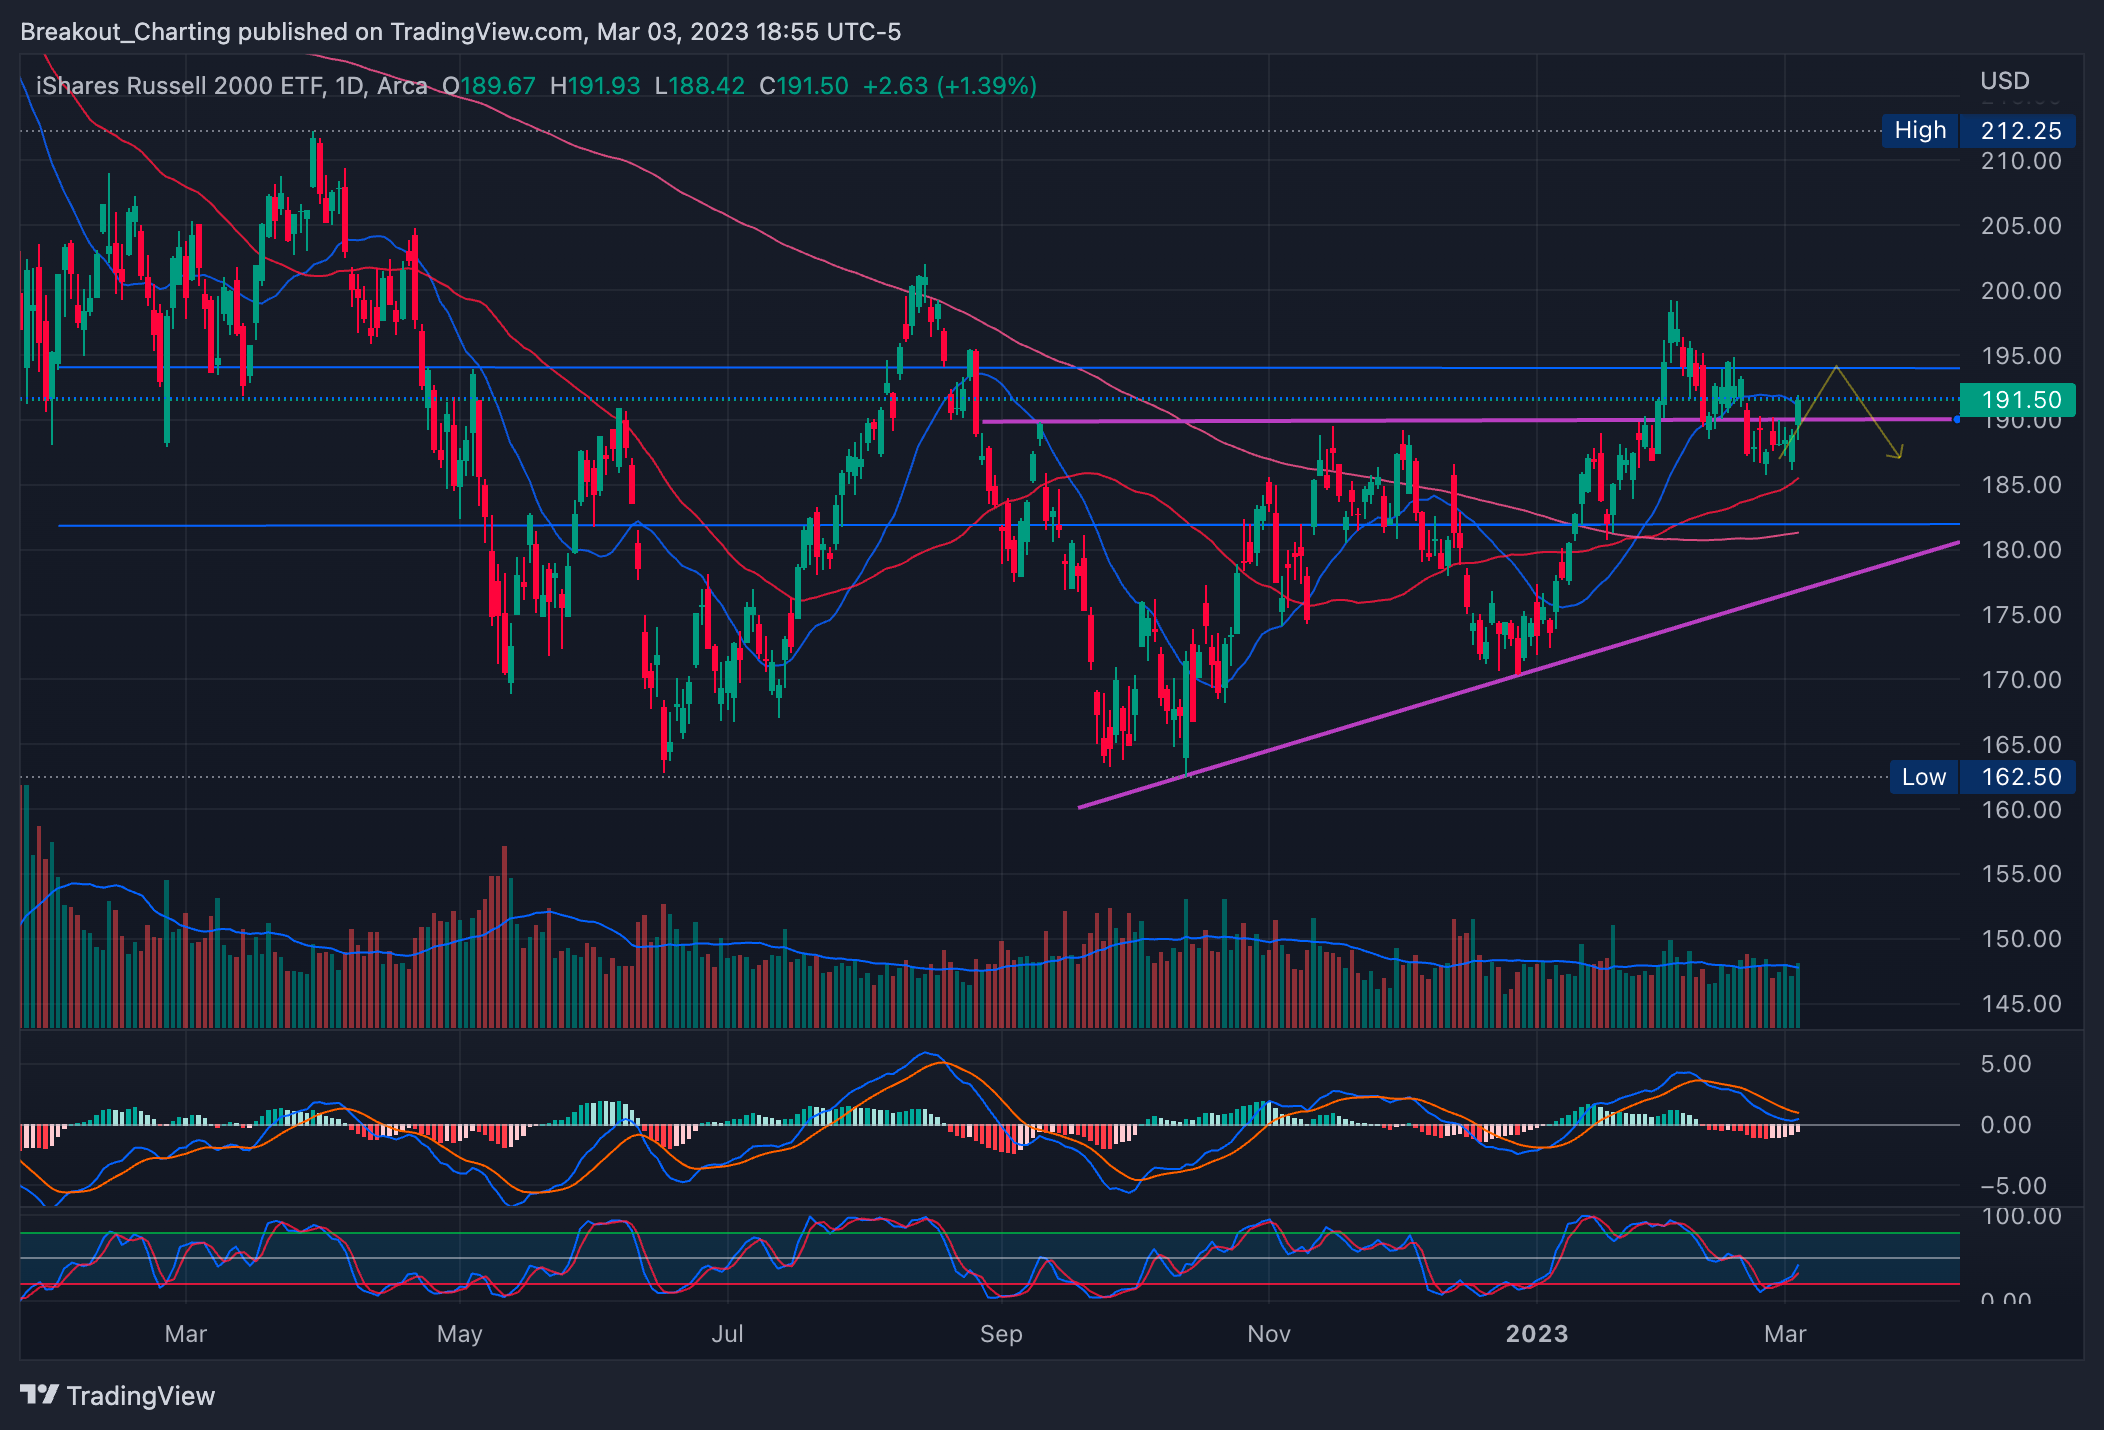
Weekly: Bullish structure with double bottom and handle. Found support at trend cloud. Momentum looks to be fading so we’ll see if this can hold. See how we interact with that 194 level.
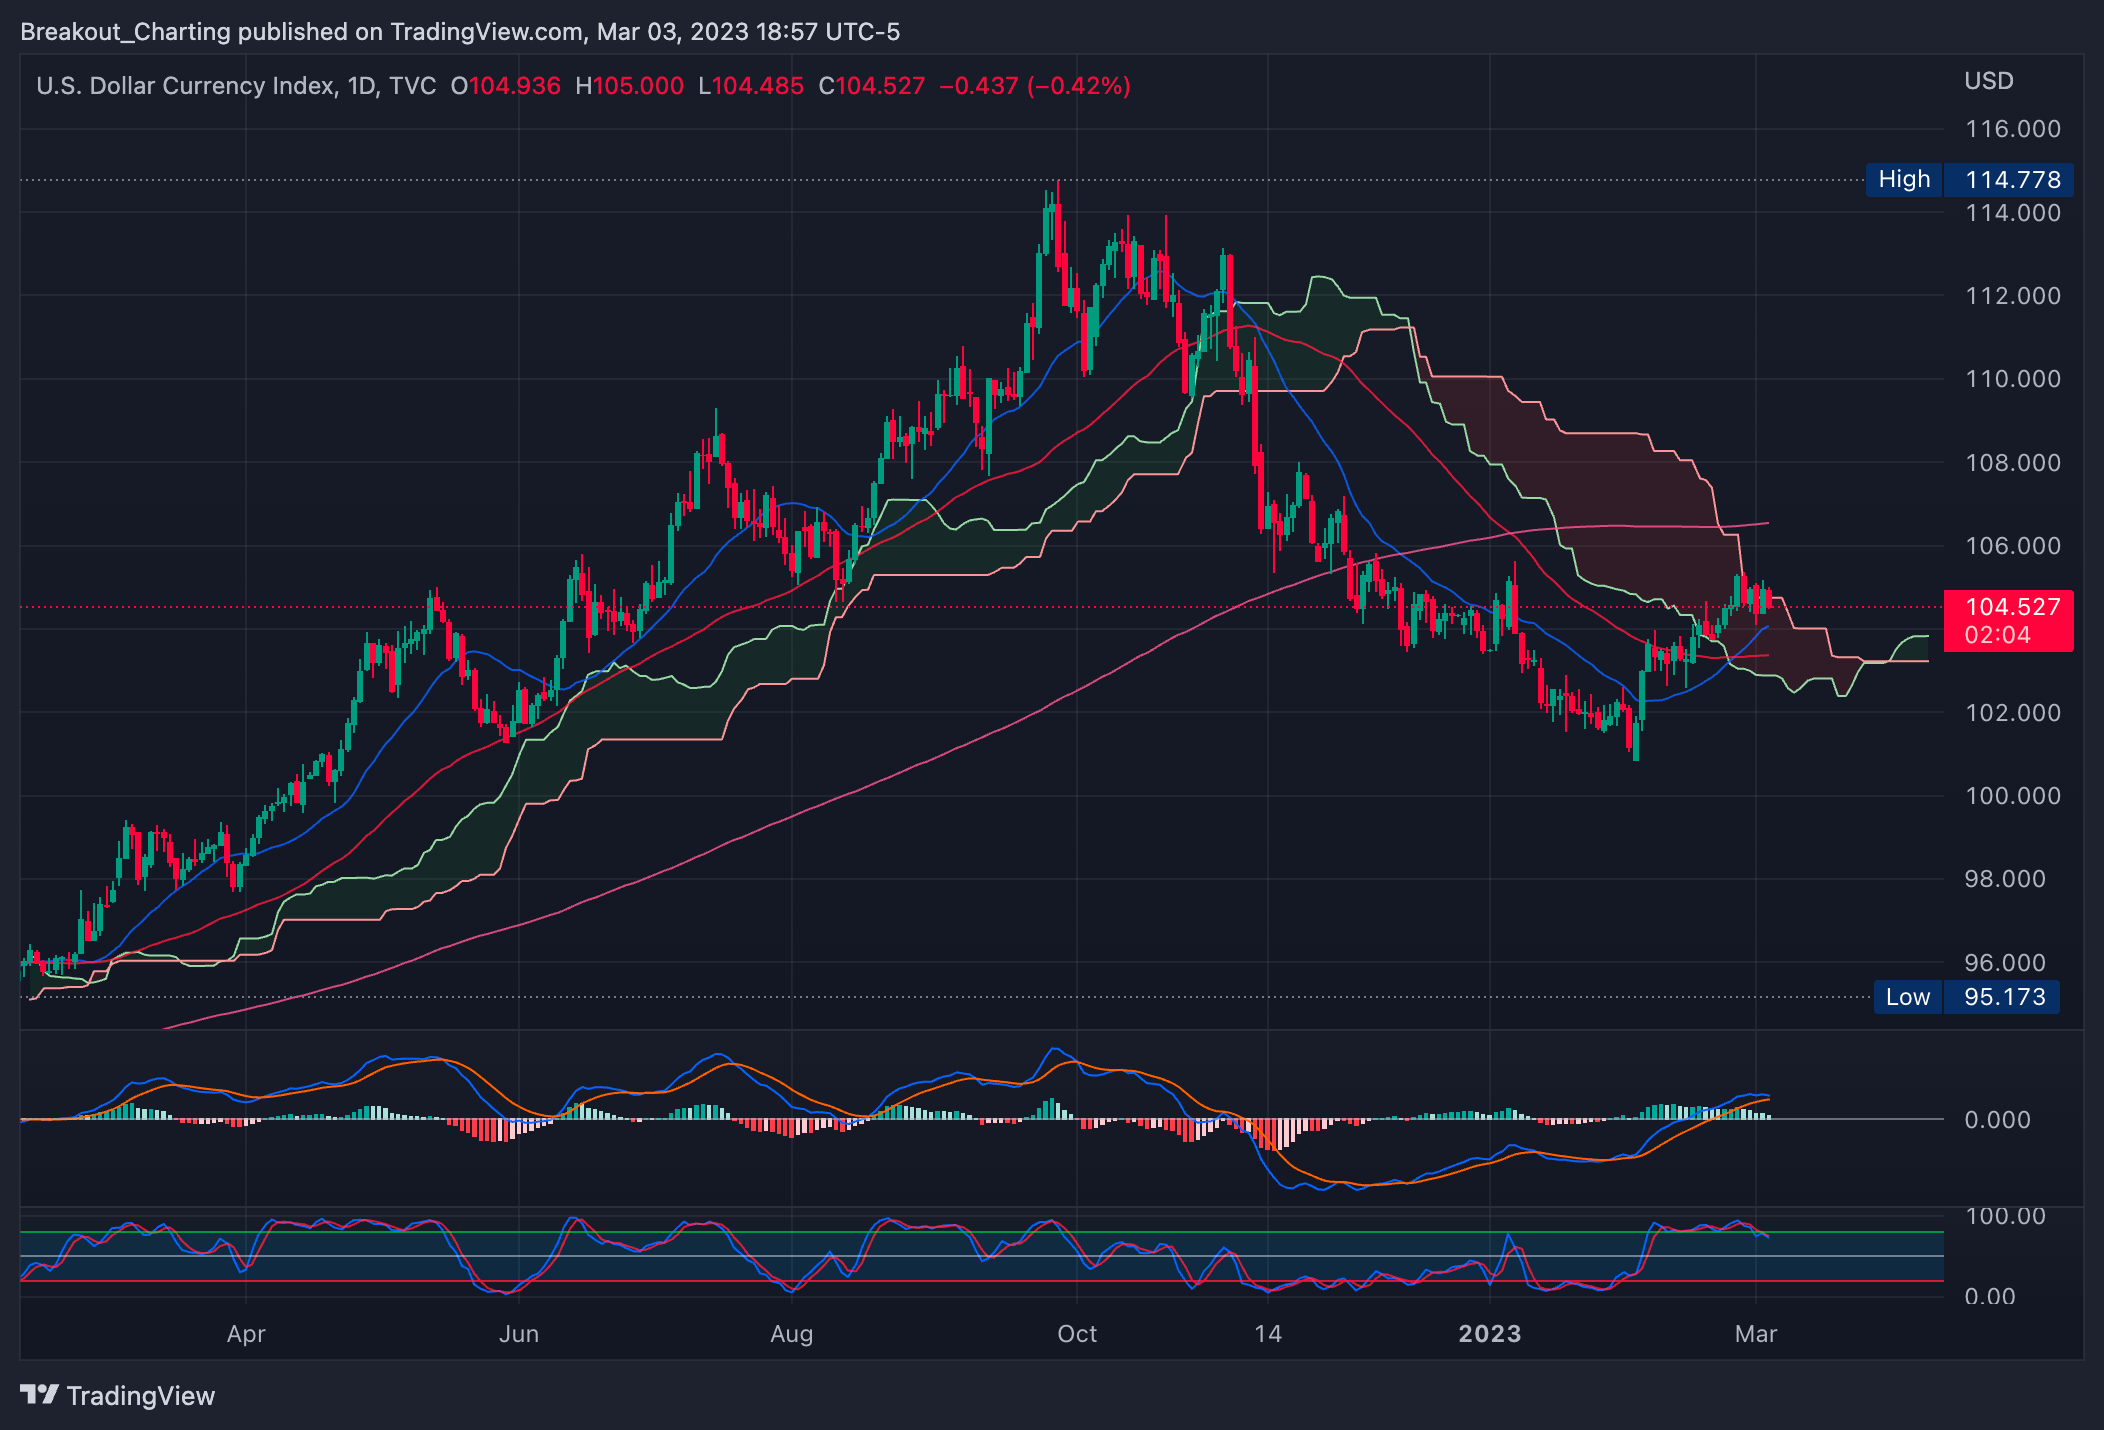
DXY - US Dollar: Cannot break the trend cloud. I think this can find some support either at the 20ma or 50ma but momentum is fading. Trend is Bullish.
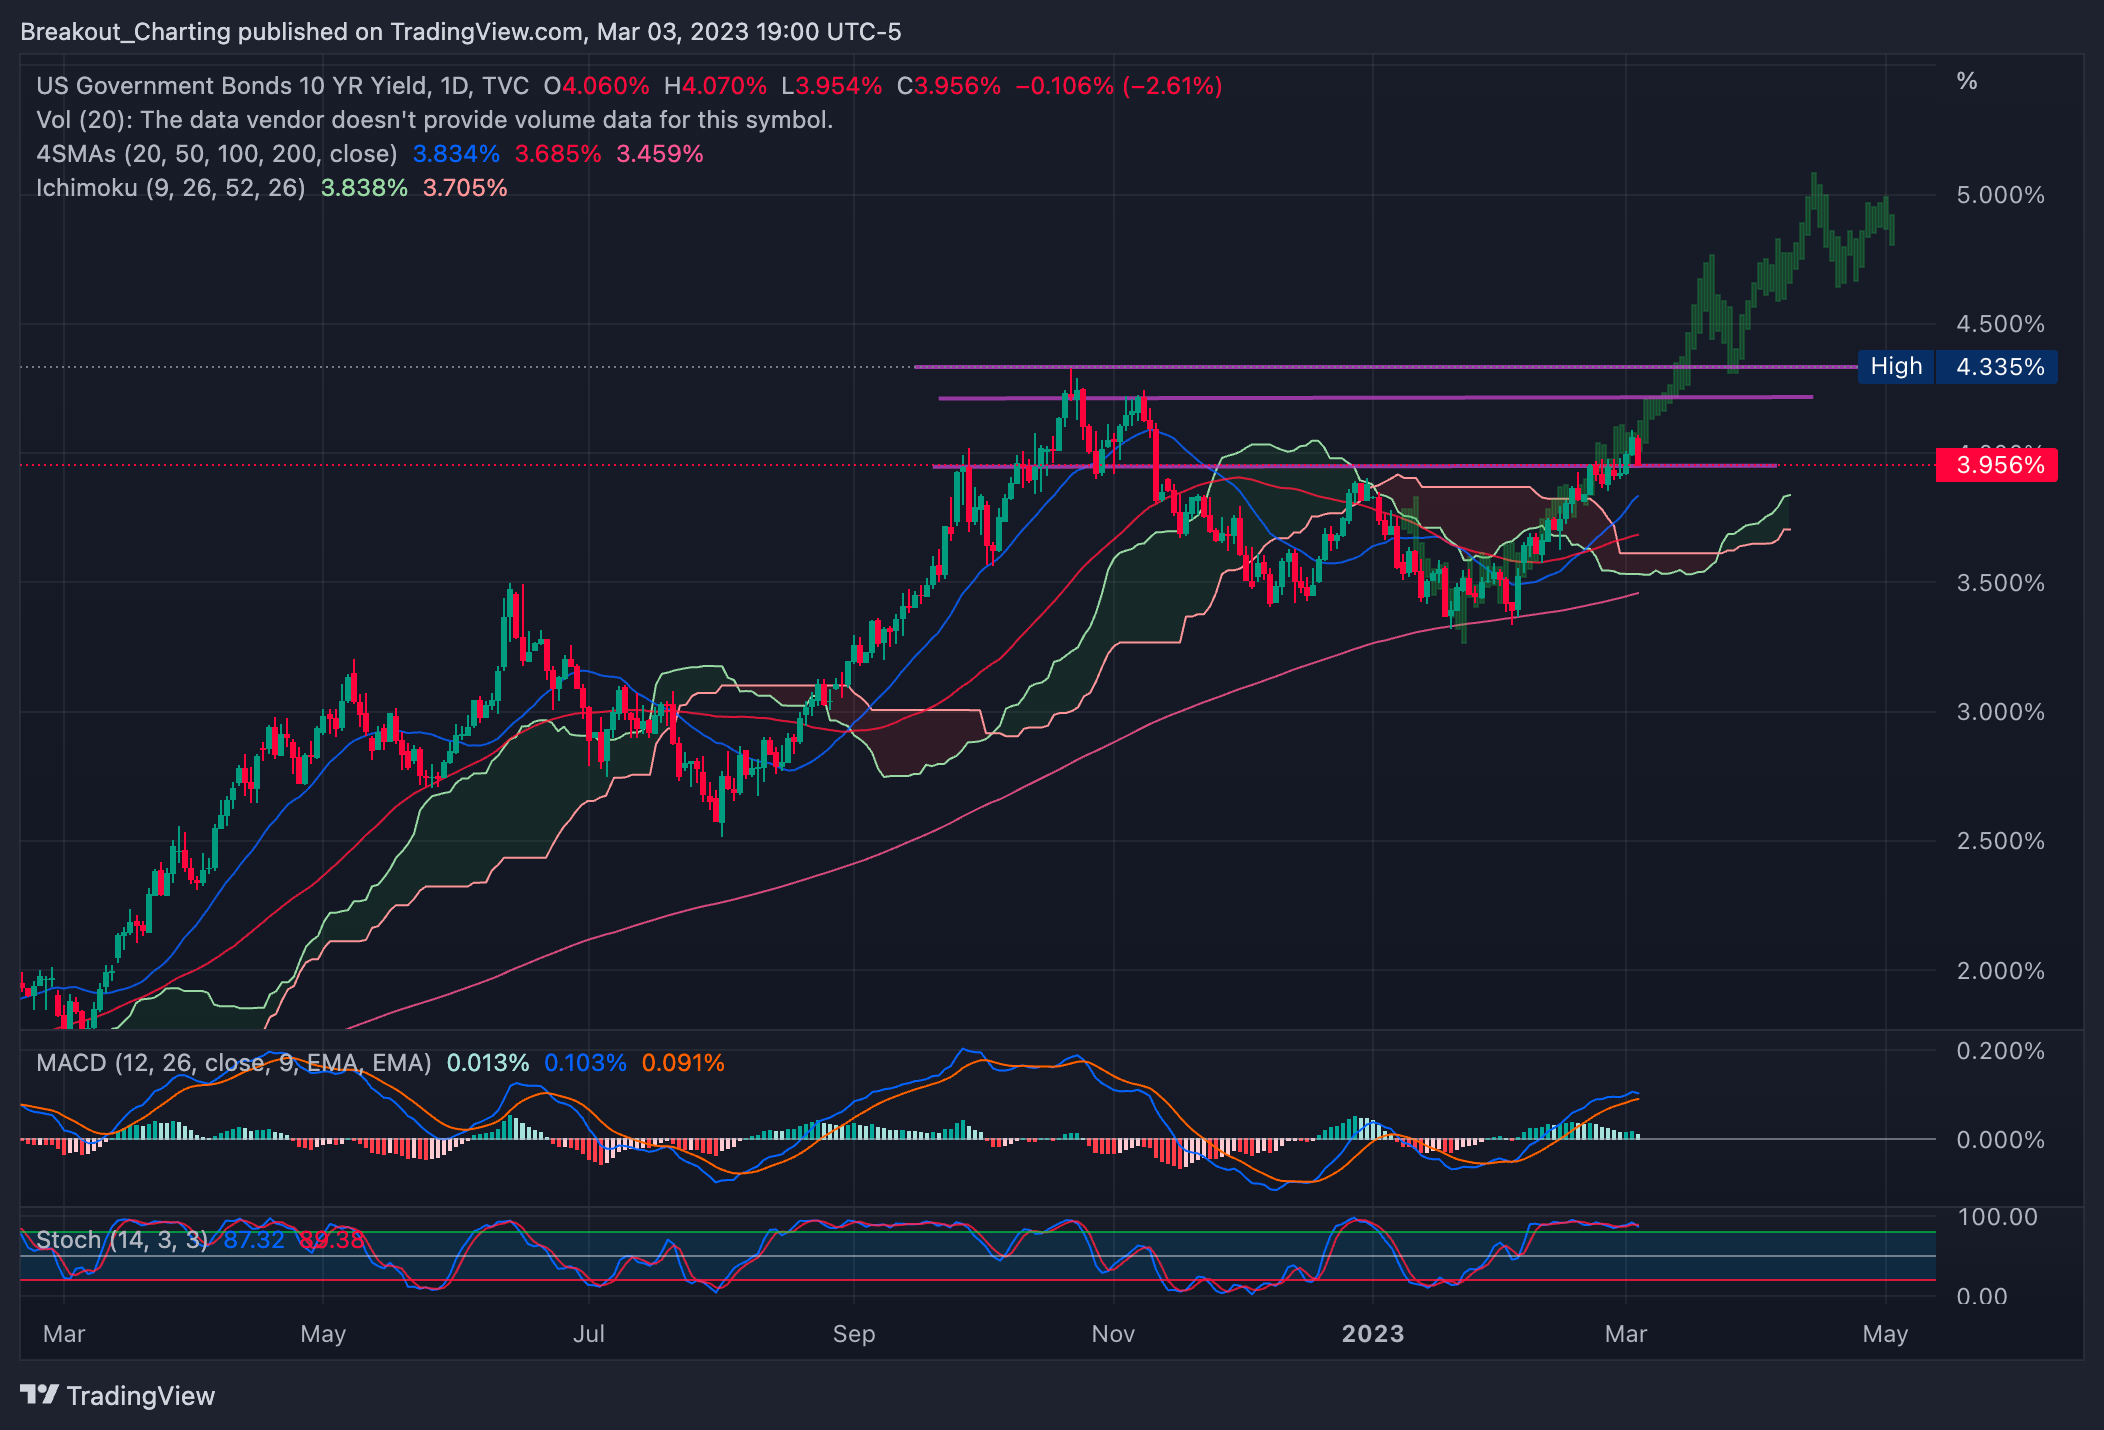
TNX - US10Y: Momentum is fading here but we are above support still. Think this could pullback to 20ma or 50ma. See if those offer support.
Summary:
Still have bias that we break to the downside since we are below trend cloud but it was a strong finish to the week. I called out the lines in the sand whether they’re gap fills or fib levels. Keep an eye on those levels and have a great weekend! We’ve got Powell speaking on Tuesday and Jobs on Friday.